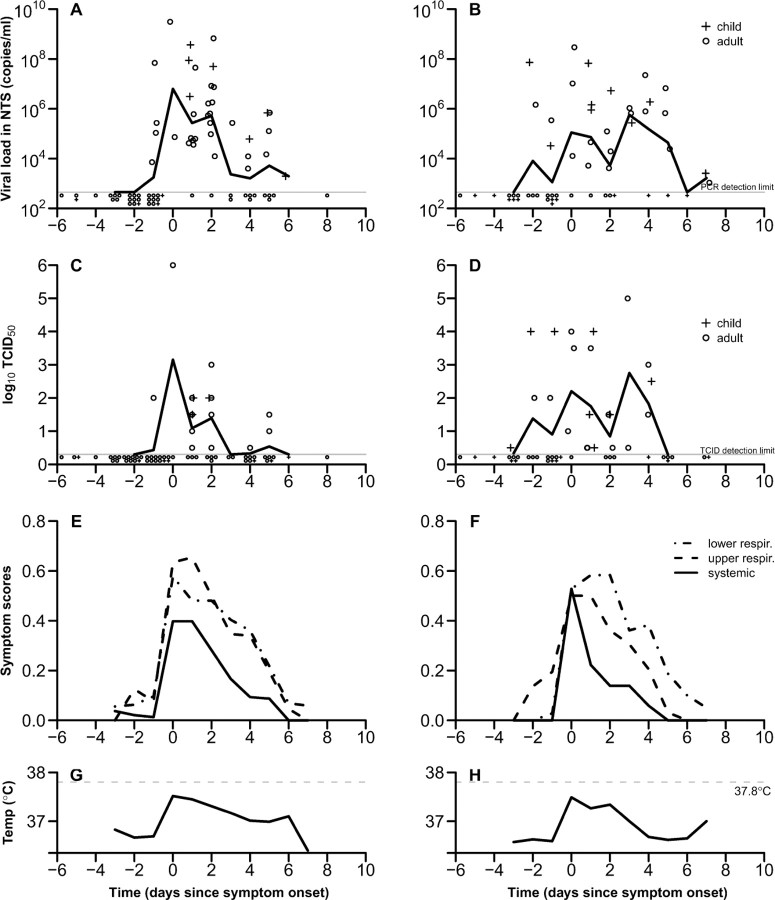
Figure 1.
Patterns of viral shedding and symptoms and signs in naturally acquired influenza A and B virus infections by day relative to acute respiratory illness (ARI) onset (day 0). Top row: Viral shedding for children (plus signs) and adults (circles), and the geometric mean viral shedding (solid lines) of (A) 26 individuals with influenza A and (B) 18 individuals with influenza B virus infections. The lower limit of detection of the reversetranscription polymerase chain reaction assay was ∼900 copies/mL (gray line). Second row: Median tissue culture infectious dose (TCID50) of specimens collected from children (plus signs) and adults (circles), and the geometric mean TCID50 of (C) influenza A and (D) influenza B. Third row: Symptoms and signs for subjects with (E) influenza A and (F) influenza B virus infection are split into lower respiratory (dotted line), upper respiratory (dashed line), and systemic (solid line). Bottom row: Mean tympanic temperature associated with (G) influenza A and (H) influenza B virus infections. ARI onset is defined as at the first day with ⩾2 of the 7 signs or symptoms listed in Table 2. Individuals with asymptomatic or subclinical infections were excluded. NTS, nose and throat swab specimen.

