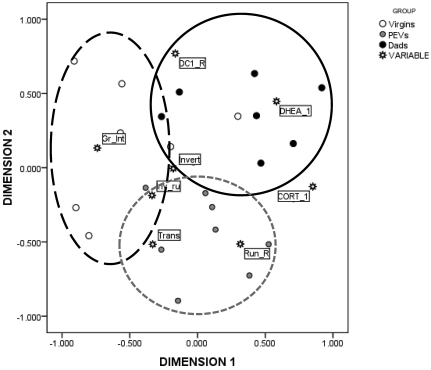
Figure 7.
Multidimensional scaling map of the association between the behavioral and physiologic responses during the open-field test. Dimensions represent linear combinations of the original variables which are not correlated; therefore they are useful to order the original variables in the map along a continuum. Dimensions are thought to ‘explain’ the perceived similarity between variables. In our dataset, dimension 1 represents the distance between physiologic responses (corticosterone [CORT_1] and DHEA [DHEA_1]) and grooming interrupted (Gr_Int). Circles on the map are arbitrary and are only useful to focus on the interpretation given according to the relative distances. Criteria to draw circles included maximizing the number of subjects in the same group per circles while minimizing the area of overlapping among different circles. In the proposed interpretation, Dads are clustered together with high physiologic responses (circle 1, black dots), whereas PEV are clustered with a variety of behavioral responses (circle 2, gray dots). In contrast, control virgins are characterized by high levels of interrupted grooming sequences (Circle 3, white dots), a seemingly less adaptive strategy to cope with the anxiety provoked by the open-field test. DC_R, DHEA:CORT ratio; CORT_1, corticosterone levels; DHEA_1, DHEA levels; Gr_Int, grooming interrupted; Invert, inverted running; Inv_ru, changes of direction; Run_R, running clockwise; Trans, behavioral transitions.

