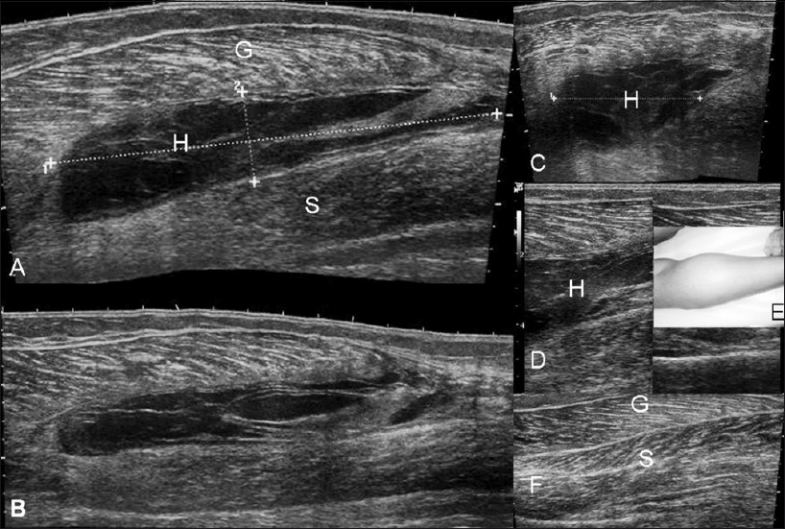
Figure 3 (A–F).

Case 1. Hematoma. Longitudinal, extended-field-ofview (A,B), transverse (C) and longitudinal (D) images demonstrate a large collection / hematoma (H) between the gastrocnemius (G) and the soleus (S). The clinical picture (E) shows the swelling. The normal contralateral USG (F) is shown for comparison
See Video 1 at www.ijri.org: Case1. Longitudinal sonography showing internal swirling movements in the hematoma
