FIGURE 3.
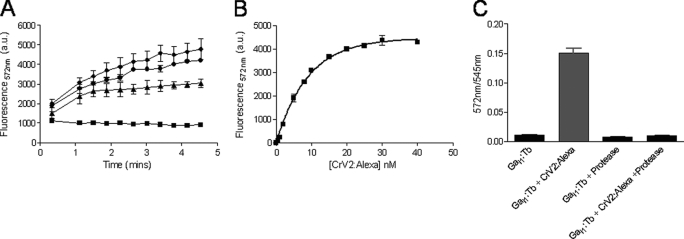
CrV2-Alexa association with Gαi1-Tb increases TR-FRET to saturation, and treatment with proteinase K abolishes TR-FRET. TR-FRET measurements were taken using a Victor3 plate reader set for time-resolved fluorescence with the following parameters: λex 340 nm, λem 572 nm, 50-μs delay. and 900-μs counting duration. A, 10 nm Gαi1-Tb (■) was mixed with 20 nm (▴), 40 nm (●), or 100 nm (♦) CrV2-Alexa. Data shown are mean (n = 2). B, 10 nm Gαi1-Tb was mixed with increasing concentrations (0–40 nm) of CrV2-Alexa, and TR-FRET was measured following 10 min of incubation. The background from 10 nm Gαi1-Tb has been deducted, and an apparent dissociation constant (Kd) of 6.2 nm was calculated. Data shown are mean ± S.E. (n = 3). C, 10 nm Gαi1-Tb was mixed with 20 nm CrV2-Alexa ± 0.1 mg/ml proteinase K. After an incubation period of 30 min at 37 °C, TR-FRET measurements were taken. Data shown are mean ± S.E. (n = 3) of the ratio of acceptor emission: donor emission.

