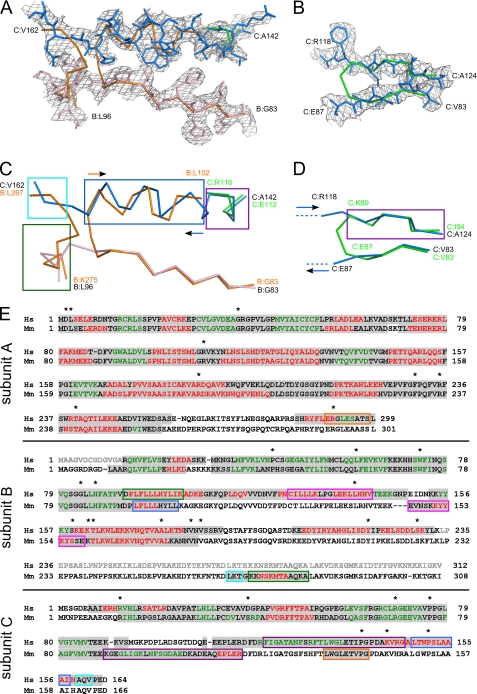
FIGURE 2.
Tracing differences between the human and mouse RNase H2 structures. A and B, two regions with the largest differences in tracing between human and mouse structures are shown. The human structure is shown in stick representation and colored in light pink for subunit B and blue for subunit C. The backbone trace of the mouse structure is shown in orange (subunit B) and green (subunit C). A simulated annealing omit electron density map from the human structure contoured at 1σ is overlaid on the superimposition. C and D, the same views are shown but with both proteins shown as a backbone trace. In C, the polarities of the helices are shown with arrows colored as the protein subunits. E, sequence alignment of human (Hs) and mouse (Mm) RNases H2. The sequence highlighted in gray is observed in respective structures. The sequence colored in red corresponds to α-helices, and the sequence colored in green corresponds to β-strands. The sequence shown in gray lettering was removed from the human complex construct used for crystallization. The regions that have different tracing between human and mouse models are boxed. Corresponding colors denote sequences that are built in the same locations in the human and mouse structures. These regions are also indicated in C and D using boxes of the same color. Asterisks show the positions of AGS mutations.

