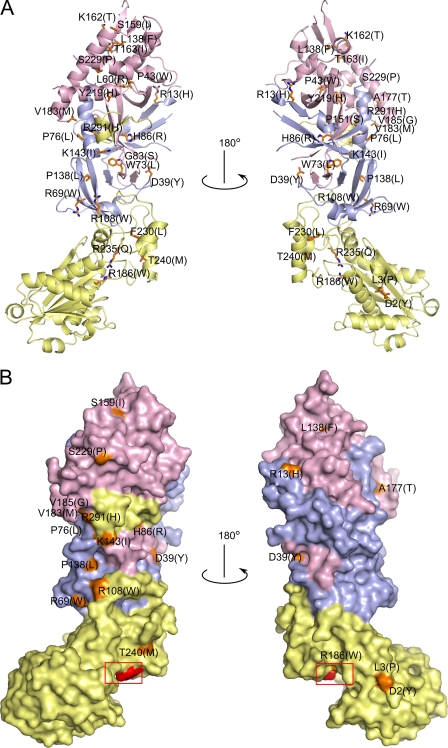
FIGURE 3.
Aicardi-Goutières syndrome mutations in human RNase H2. A, shown is a schematic representation of the structure with the sites of mutations shown as orange sticks. B, shown is a surface representation of the structure showing the localization of surface-exposed mutation sites colored and labeled as in A. The red box indicates the position of the active site.

