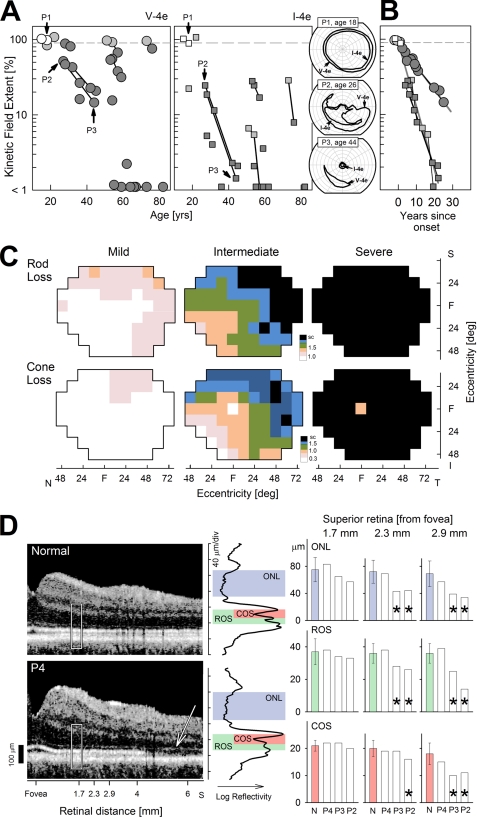
FIGURE 1.
Retinal phenotype of humans with adRP caused by the P23H opsin gene mutation. A, extent of the kinetic visual field (for the larger V-4e stimulus, left, and smaller I-4e, right) is shown as a function of age for 19 patients. Longitudinal data from a subset of the patients are shown as symbols connected by lines. Fields that are normal (>90%) are shown with unfilled symbols, and fields that are abnormal with dark gray symbols; light gray symbols refer to those patients with normal V-4e but abnormally reduced I-4e fields. Inset (right), three representative patients showing a full visual field (P1), altitudinal (superior field) loss (P2), and a small central island with a residual island of nasal field function (P3). B, extent of visual field constriction for the I-4e stimulus shows a faster progression rate compared with that measured with the V-4e stimulus in the subset of patients with longitudinal data. Presumably, visual field constriction in all individuals progresses with an invariant exponential rate (7%/year for V-4e and 18%/year for I-4e) after a variable age of disease onset, which is estimated from the average of the intercepts fit to log-linear data for each target. C, retinal topography of rod sensitivity loss (upper row) and cone sensitivity loss (lower row) demonstrating mild (n = 2; ages 15 and 22), intermediate (n = 5; ages 18–54), and severe (n = 6; ages 30–82) stages of this disease. Rod loss was measured with a 500-nm stimulus (dark-adapted) and cone loss with a 600-nm stimulus (light-adapted). Color changes delineate the 50th percentile contour for a given level of sensitivity loss (specified in log units on the color scale; sc, scotoma). Maps are shown as visual fields of the right eye. S, I, N, and T refer to superior, inferior, nasal, and temporal visual field, respectively. D, retinal laminar architecture of a normal control subject (age 31) and P4 (age 18) imaged with optical coherence tomography along the vertical meridian from the fovea extending 6.5 mm into the superior retina. White rectangle represents location of the LRP shown on the right (black trace). Correspondence between local reflectivity changes on the LRPs and anatomical laminae of ONL, rod, and cone outer segments are shown. The thickness of the laminae was quantified at three neighboring locations (centered at 1.7, 2.3, and 2.9 mm from the fovea in the superior retina) in three patients (P4, P3, and P2) and compared with results in normals (error bars ±2 S.D.). Significant differences from normal are marked with an asterisk. Note the superior retinal region in P4 with remaining ONL showing loss of the signal originating from the connecting cilium between inner and outer segments (arrow).

