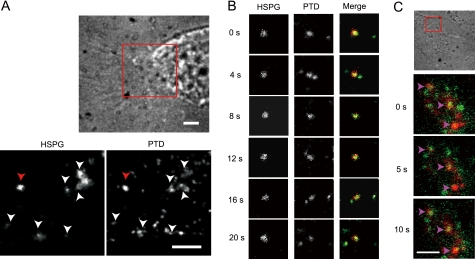
FIGURE 6.
Co-mobilization and co-internalization of TatP and HSPG. A, bright field image (upper panel) and fluorescence images in the red square were obtained using dual imaging system (lower panel) at 200 ms/frame. Fluorescence images of TatP-QD525 (lower left panel) and HSPG as detected by F58-10E4 plus secondary Ab labeled with QD705 (lower right panel) at 20 min of TatP exposure. Arrowheads indicate co-localization spots of TatP and HSPG. Bars, 5 μm. B, time course fluorescence images of TatP and HSPG of the red arrow in A. (See also supplemental Video 8.) C, bright field image (upper) and selected frames of merged fluorescence images of TatP (green) and HSPG (red) at 45 min of TatP exposure. Arrowheads indicate co-localization of TatP and HSPG. Images are contrast-enhanced. Bar, 1 μm.

