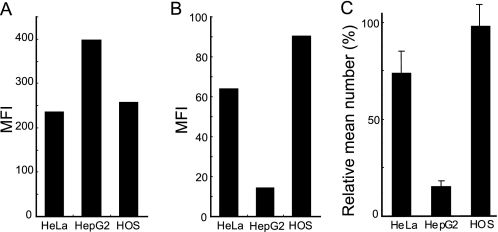
FIGURE 7.
Levels of HSPG expression and TatP-binding capability in various cell lines. A, HSPG (as detected by F58-10E4) expression in HeLa, HepG2, and HOS by FACS. B, levels of 8-val TatP-QDs bound in HeLa, HepG2, and HOS as examined by FACS. C, relative mean number of 8-val TatPs/cell on different cells at 15 min of TatP exposure as observed by single molecule microscopy. Data are based on 20 observed cells. Bars, S.D.

