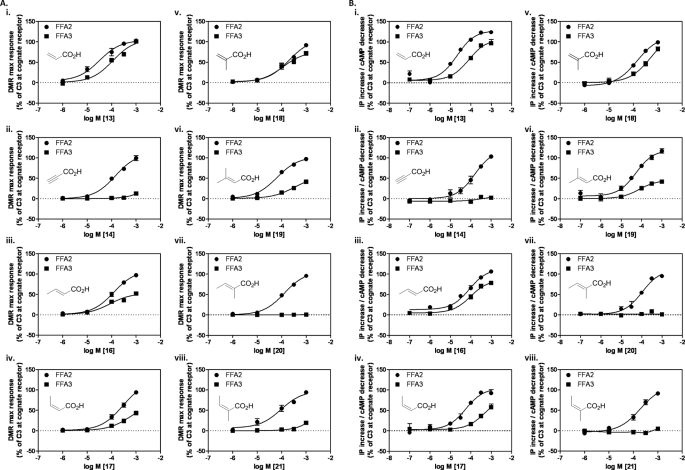
FIGURE 4.
Structure-activity relationships of conjugated unsaturated SCAs at FFA2 and FFA3. A, panels i–viii, DMR maximum response (pm) concentration-response curves to conjugated unsaturated SCAs were generated for either FFA2 (circles) or FFA3 (squares). Data are mean ± S.E., n = 3. B, panels i–viii, concentration-response curves of the same chemical series in IP1 (FFA2) and cAMP (FFA3) assays. Data are mean ± S.E., n = 3.

