FIGURE 3.
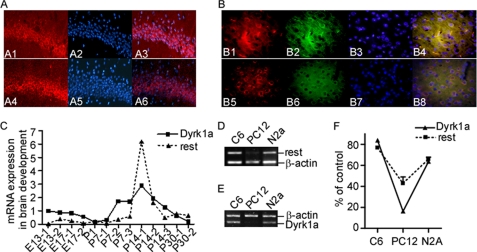
DYRK1A and REST coordinately expressed in mouse brain during neurodevelopment and in cell lines. A and B, immunofluorescence staining was performed on coronal slices from adult mouse brain. A Cy3-conjugated anti-rabbit secondary antibody was used to visualize DYRK1A (A1 and B1, red) and REST (A4 and B5, red). MAP2 (microtubule-associated protein 2) was stained to serve as a neuronal marker. A fluorescein-conjugated anti-mouse secondary antibody was used to visualize MAP2 (B2 and B6, green). The nuclei were counterstained with blue DAPI (A2, A5, B3, and B7). Overlay showed that both DYRK1A and REST are enriched in neurons in hippocampus (A3 and A6) and cerebral cortex (B4 and B8). The images were captured with a Leica fluorescence microscope at ×400 (A) or ×600 (B). C, quantitative RT-PCR was performed on cDNA templates prepared from normal mouse brain aging at embryonic days 13 (E13) and 17 (E17); at P1, P7, P14, and P30; and in adult mice. One to three mice were used in each time point as indicated by the numbers after the hyphens. p = 0.0028 by correlation test. Rest (D) and Dyrk1a (E) mRNA levels were determined by RT-PCR in C6, N2A, and PC12 cells. β-Actin was amplified as the internal control. F, quantification of D and E showed that Rest and Dyrk1a were coordinately expressed at low levels in PC12 cells and at high levels in N2a and C6 cells. The values represent the means ± S.E. (n = 3). *, p = 0.0002 by correlation test.

