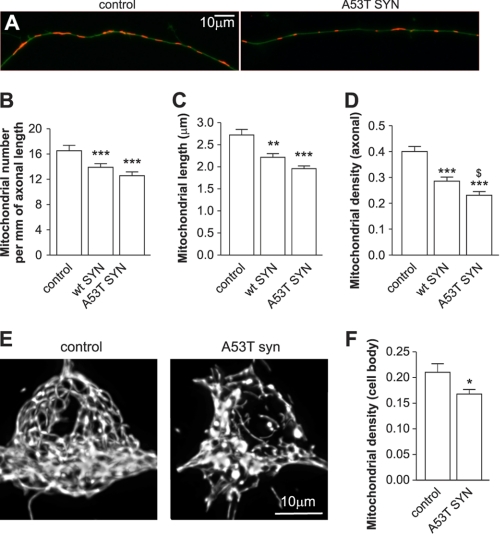
FIGURE 3.
Overexpression of α-synuclein leads to mitochondrial loss. Cortical neurons were cotransfected with plasmids expressing WT or A53T mutated α-synuclein, GFP, and mitochondrially targeted pDsRed2 at day 2 after plating and visualized 6 days later. A, morphometric analysis of axonal mitochondria demonstrated that the mitochondrial number per mm axonal length (B), average mitochondrial length (C), and mitochondrial density (mitochondrial length per axonal length) (D) decreased in WT or mutant A53T α-synuclein overexpressing neurons. Note that the effect of mutant A53T α-synuclein is more pronounced than the WT protein (one way ANOVA followed by Newman Keuls test). To compare the mitochondrial density in the neuronal body between the control and mutant A53T α-synuclein expressing neurons, we performed a three-dimensional scan using a confocal microscope followed by three-dimensional reconstruction of the mitochondrial network in the neuronal body. E, three-dimensional reconstruction of the mitochondrial network from control neurons or mutant A53T α-synuclein expressing neurons. F, further stereological analysis of three-dimensional reconstructed mitochondrial networks in control neurons or in neurons expressing mutant A53T α-synuclein revealed a clear decrease in mitochondrial volume per cell volume (t test). *, p < 0.05; **, p < 0.01; and ***, p < 0.001 versus control; and $, p < 0.05 versus WT α-synuclein.

