FIGURE 2.
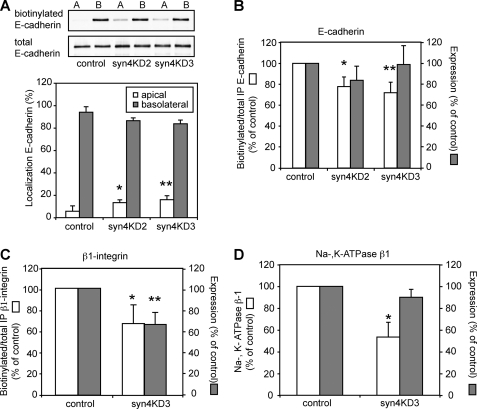
Knockdown of syntaxin 4 results in intracellular accumulation of basolateral proteins. The apical or basolateral membrane surface of syntaxin 4 knockdown and control cells were biotinylated and the extent of biotinylation was determined after immunoprecipitation of E-cadherin or β1-integrin. A, top, Western blots of biotinylated E-cadherin and total E-cadherin for control (LucKD), syn4KD2, and syn4KD3 cells. Note the small increase in apical E-cadherin for the knockdown cells. Bottom, biotinylated apical and basolateral E-cadherin was quantified as percentage of total biotinylated E-cadherin. Apical, open bars, basolateral, closed bars. These results are the mean of three independent experiments (*, p < 0.01; **, p < 0.001). B, biotinylated E-cadherin was quantified as the percentage of total immunoprecipitated E-cadherin and the results are normalized to control cells (open bars). These results are the mean of three independent experiments (*, p < 0.005; **, p < 0.005). The closed bars show expression levels of E-cadherin in lysates of control, syn4KD2, and syn4KD3 cells. C, biotinylated β1-integrin was quantified as percentage of total immunoprecipitated β1-integrin and the results are normalized to control cells (open bars). These results are the mean of three independent experiments (*, p < 0.05). The closed bars show expression levels of β1-integrin in lysates of control and syn4KD3 cells (**, p < 0.001). D, quantification of pulled down biotinylated Na,K-ATPase β1 and total Na,K-ATPase β1 in syn4KD3 as the percentage of control cells. The results are the mean ± S.D. of three independent experiments (*, p < 0.05).

