FIGURE 3.
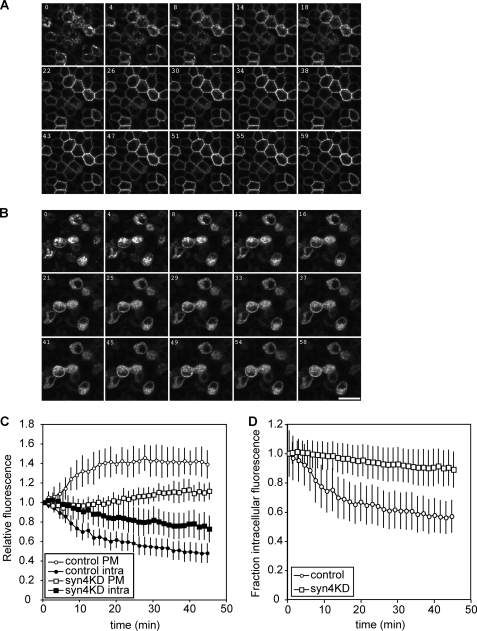
Transport of VSV-G-EGFP tsO45 in control and syntaxin 4 knockdown cells. Control cells (LucKD cells) and syn4KD3 cells were infected with adenovirus for VSV-G-EGFP tsO45 and incubated overnight at 39.5 °C. After 18 h, cells were incubated at 19.5 °C for 2 h and transferred to 32 °C. Transport of VSV-G-EGFP tsO45 was followed for 45 min and imaged using confocal microscopy. A, transport of VSV-G-EGFP tsO45 in control cells. B, transport of VSV-G-EGFP tsO45 in syn4KD3 cells. Scale bar is 20 μm. C, quantification of plasma membrane fluorescence (open circles, control cells; open squares, syn4KD cells) and intracellular fluorescence (closed circles, control cells; closed squares, syn4KD cells). The results are shown as mean ± S.D. of 12 individual cells. D, change of intracellular fluorescence for control and syn4KD3 cells as a fraction of total fluorescence (open circles, control cells; open squares, syn4KD3 cells).

