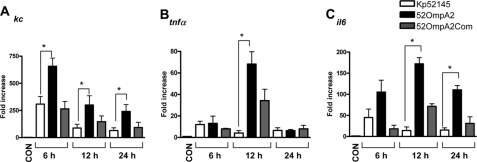
FIGURE 3.
Proinflammatory cytokine expressions in mice lungs after K. pneumoniae infections. Mice were non-infected (white bars, n = 5) or infected with wild-type K. pneumoniae 52145 (black bars, n = 15), 52OmpA2 (black bars; n = 15), or 52OmpA2Com (gray bars; n = 15). kc (A), tnfα (B), and il6 (C) mRNA expressions in whole lungs at the indicated time points postinfection were assessed by RT-qPCR (5 mice/time point). Bars, mean ± S.E. (error bars). *, p < 0.05 (for the indicated comparisons; one-way ANOVA).

