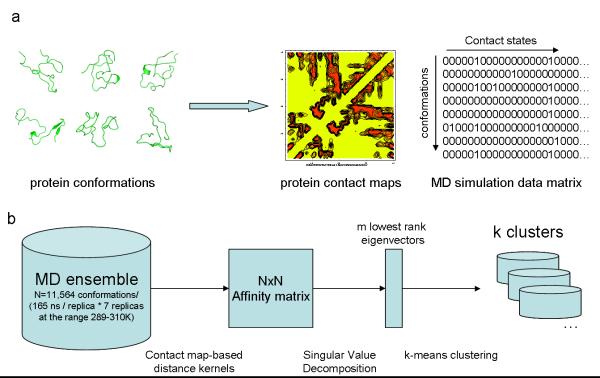
Figure 6. Flow diagram of the spectral clustering method.
In (a) a diverse ensemble of conformations obtained from enhanced-sampling molecular dynamics is encoded as a binary distance matrix (contact matrix) where each column represents the state of a residue contact (i,j) defined according to a distance threshold of 4.5Å between any pair of heavy atoms belonging to residues i and j. In (b) the original MD dataset, in the contact matrix representation is used to calculate a square Affinity matrix, whose elements are given by e−Dij where Dij is the distance between conformations with indices i and j according to a chosen distance kernel. The singular value decomposition of the Affinity matrix yields eigenvectors of high discriminative power. In particular, the m lowest non-trivial eigenvectors (where m<<N) can be used as explicit coordinates to separate the MD ensemble into k clusters using the k-means clustering algorithm.

