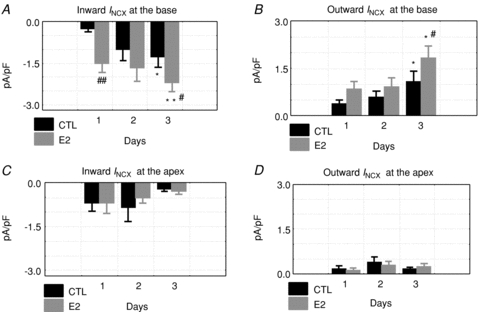
Figure 6. Effects of E2 on inward and outward INCX, base and apex.

Inward and outward INCX were compared as a function of time (days 1–3) for control (CTL: incubated in DMSO alone) and oestrogen treated myocytes (E2: incubated in 1 nm E2/DMSO). Friedman's ANOVA for repeated measurements was used to test for statistically significant changes in current. At the base, the inward (A) and outward (B) currents changed significantly with *P < 0.05 and **P < 0.01 for day 1 vs. 3 and #P < 0.05 and ##P < 0.01 for CTL vs. E2 on the same day. In myocytes from the apex, the currents did not exhibit statistically significant changes (C and D). Friedman's ANOVA for repeated measurements yielded P= 0.89 for apex controls for day 1 vs. 3 and P= 0.37 for apex E2 vs. control for inward INCX (C), and P= 0.22 for apex control for day 1 vs. 3 and P= 0.61 for apex E2 vs. control for outward INCX (D).
