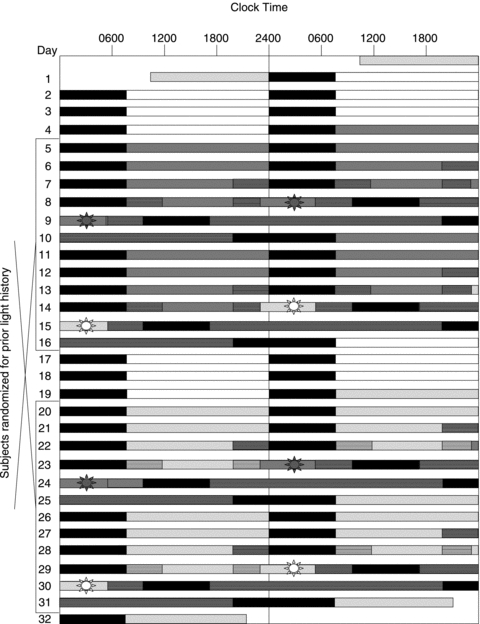
Figure 1. Double-plotted raster of the 32 day protocol.

This raster represents one of the two study designs, i.e. with the sequence of the prior light history being 1 lux for the first half and 90 lux for the second half of the protocol, as an example for a subject with a habitual bedtime of 24.00 h. Different light levels are represented by the following coloured bars: white (450 lux on days 2–4 and 17–19), light grey (90 lux on days 1, 20–23, and 26–28), dark grey (1 lux on days 5–7 and 11–14), and black (sleep episodes in 0 lux). Constant posture conditions are denoted by bars with horizontal stripes. Four 6.5 h LE sessions are represented by bars with a sun symbol: 2 control LE (days 8 and 23) and 2 experimental LE (days 14 and 29).
