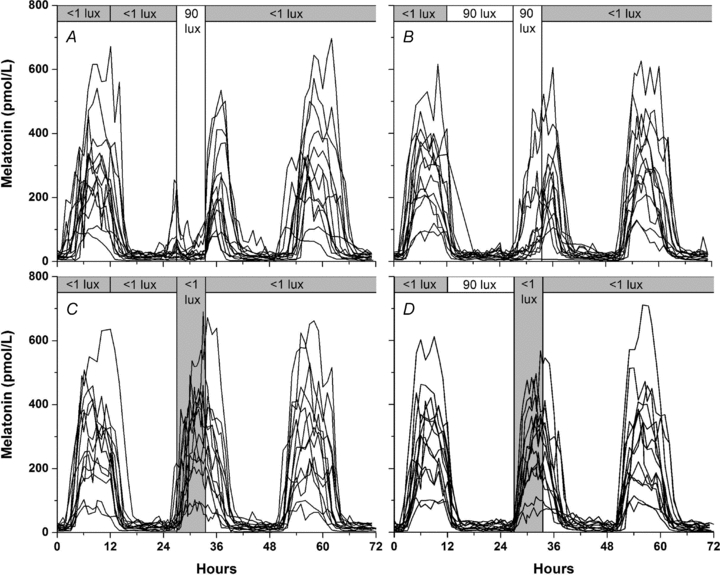
Figure 2. Melatonin profiles under different light conditions.

Individual melatonin profiles from 13 subjects during 4 different light conditions: 1 lux prior light history and 90 lux LE (A), 90 lux prior light history and 90 lux LE (B), 1 lux prior light history and 1 lux LE (C), and 90 lux prior light history and 1 lux LE (D). Hourly plasma melatonin levels are shown for 72 h (3 consecutive days) beginning on the day prior to LE (hour 0) in each condition. The vertical bar from 27 to 33.5 h on each panel shows the 6.5 h LE and the top horizontal bar shows the light history and the light conditions prior to and following the LE. Panel C shows the control condition for panel A, and panel D is the control condition for panel B. Note the strong suppression in panel A, compared with weak suppression in panel B.
