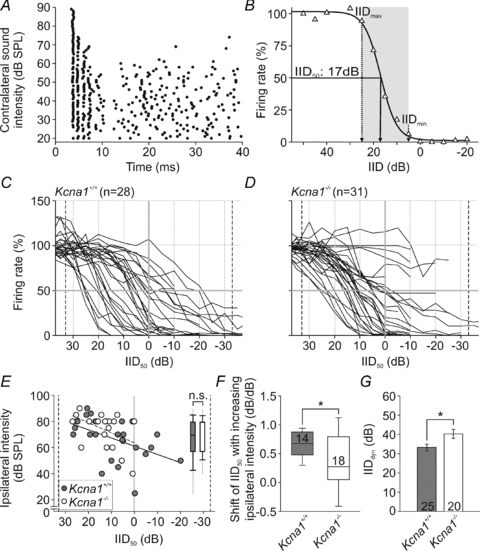
Figure 3. IID encoding in Kcna1+/+ and Kcna1−/− mice.

A, dot raster display of the response of a representative unit to binaural stimulation (40 ms; CF at the respective ear); ipsilateral: 20 dB above threshold; contralateral: levels between 0 and 90 dB SPL in steps of 5 dB (presented in pseudorandom order; ordinate). Note that the firing rate decreased with increasing contralateral stimulus intensities. B, normalized firing rate (same unit as in A) plotted for different IIDs, i.e. ipsilateral minus contralateral intensity: positive IIDs representing higher ipsilateral and negative IIDs higher contralateral stimulus levels. Firing rate at ipsilateral stimulation exclusively was set to 100%. Data points were fitted by a 4-parametric sigmoid function (continuous line). From such fits, IID values corresponding to a 50% rate reduction (IID50) and the dynamic range of the IID functions (grey shaded area) were determined for further analyses. C and D, IID functions obtained from the LSO of Kcna1+/+ (C) and Kcna1−/− mice (D). While in the Kcna1+/+ LSO, IID functions are equally distributed between negative and positive IIDs, in Kcna1−/− mice, IID functions do not seem to achieve 50% rate reduction for negative IIDs. This is also shown by the uneven distribution of IID50 values between both genotypes (E). The inset in E features the range of absolute ipsilateral intensities used for the recording of IID functions in wild-type (grey) and knockout (white) LSO. F, within recordings from individual neurons, IID50 values shifted towards more positive IIDs with increasing ipsilateral intensity. This increase was significantly larger in wild-types (grey). G, the Kcna1−/− IID dynamic ranges (white) were larger and accompanied by shallower slopes.
