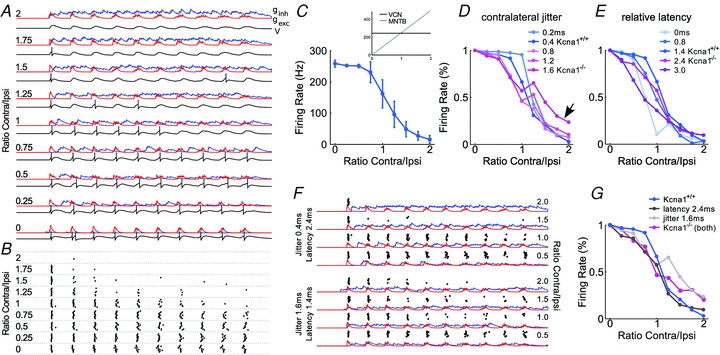
Figure 4. Computational modelling of IID tuning in Kcna1+/+ and Kcna1−/− LSO neurons.

A, excitatory (red, gexc) and inhibitory (blue, ginh) synaptic conductance and membrane potential (V, black trace below respective conductance traces) of an LSO neuron for different spike rates of the contralateral, inhibitory input (expressed as the ratio of contralateral and ipsilateral spike rates indicated on the left side). Parameters were: ipsilateral spike jitter s.d.0.15 ms, contralateral spike jitter s.d. 0.4 ms, relative mean latency 1.4 ms. B, APs (dots) of a simulated LSO neuron during 10 repetitions of a 40 ms stimulus under the conditions described in A. C, the resulting IID tuning curve of the simulated LSO neuron. The inset shows the firing rates of a prototypic VCN (black) and MNTB (grey) neuron for the respective input conditions. D and E, effects of changing the AP jitter (D) and first spike latency of spikes in the contralateral input (relative to the ipsilateral input) (E). All remaining parameters are the same as in A. Firing rate begins to decrease at lower contralateral rates in the presence of larger jitter and slopes of IID functions decrease. First-spike latency of contralateral spikes has a weaker influence on the response of the simulated LSO neuron. F, examples of simulated synaptic conductance and LSO spike trains (design same as in A) for an increased contralateral latency (top four traces) and jitter (bottom four traces). Dots indicate single APs. G, simulated IID tuning curves for the control case (as in A–C), for an increased contralateral jitter, for an increased latency, and for the combination of both. In all simulations, the ipsilateral input had a spike rate of 250 Hz, and the contralateral input was varied from 0 Hz (ratio = 0) to 500 Hz (ratio = 2).
