
Figure 2. Hypothalamic sustained cells exhibit day–night rhythms in basal and light-evoked activity.
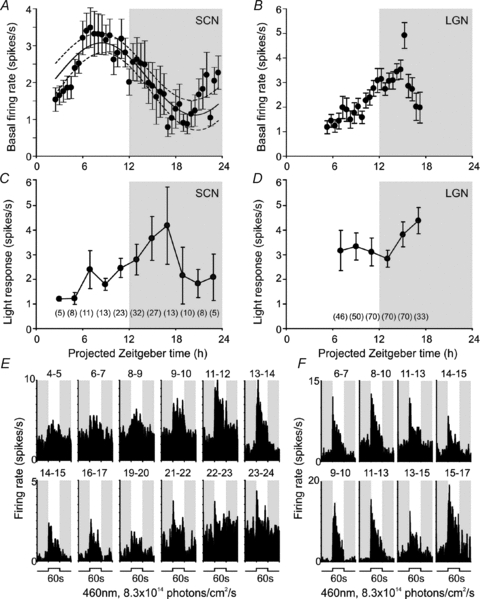
A and B, mean (±s.e.m.) basal (dark-adapted) firing rate of suprachiasmatic (SCN; A, n= 5 to 30) or lateral geniculate (LGN; B, n= 17 to 71) sustained cells at indicated time points. Curve in A represents the ±95% CI of a sinusoidal function (period = 24 h) that best fitted the data points. C and D, symbols represent mean (±s.e.m.) response of SCN (C) or LGN (D) sustained cells to 60 s light steps (change in mean spike rate during light on relative to baseline rate) at indicated time points. For C and D, numbers in brackets represent number of cells contributing to each data point. Shaded areas in A–D represent the projected night (i.e. time of light off in the animals’ home cage). E and F, examples of SCN (E) or LGN (F) sustained cells responses to 60 s light steps as a function of time. Each histogram represents the average of 2 trials between the time points indicated above the trace. Shaded areas in E and F represent epochs of darkness.