
Figure 8. Characterisation of basal and light evoked activity of delayed cells.
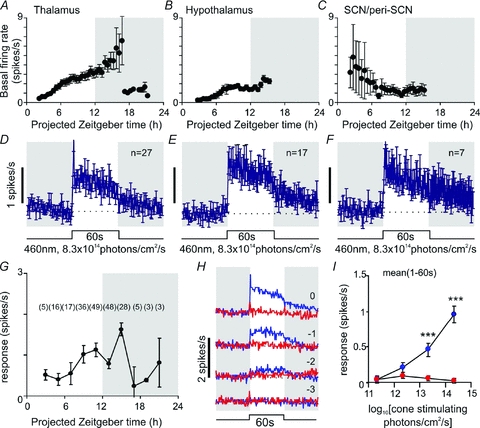
A–C, mean (±s.e.m.) basal (dark-adapted) firing rate of delayed cells recorded from the midline ventral thalamus (A, n= 5–26), perventricular hypothalamus (B, n= 3–17) or SCN region (C, n= 3–7) cells at indicated time points. D–F, mean (±s.e.m.) response of delayed cells in different anatomical subregions to bright 60 s, 460 nm, light steps. G, symbols represent mean (±s.e.m.) response of delayed cells throughout the hypothalamus and midline ventral thalamus to 60 s light steps (change in mean spike rate during light on relative to baseline rate) at indicated time points (numbers in brackets represent number of cells contributing to each data point). H, average response of all delayed cells (n= 51) to 60 s, 460 nm (blue) or 655 nm (red) light pulses of varying intensity. Shaded areas represent epochs of darkness, numbers above traces represent log intensity, relative to the unattenuated intensities (8.3 × 10¹⁴ and 2.6 × 10¹⁵ photons cm−2 s−1 for 460 and 655 nm respectively). I, quantification of data from H, showing mean firing rate 1–60 s after light on, relative to basal activity. Data in I were analysed by repeated measures ANOVA with intensity and wavelength as factors, followed by the Bonferroni post hoc test. ***P < 0.001, significant differences in responses to 460 nm and 655 nm.