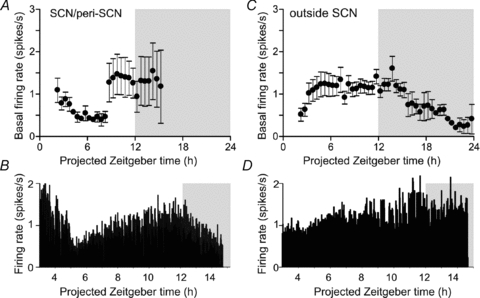
Figure 10. Anatomical variation in light-insensitive cell activity.

A and C, mean (±s.e.m.) basal (dark-adapted) firing rate of light insensitive cells recorded from inside (A, n= 4 to 19) or outside the SCN region (B, n= 3 to 16) or SCN region (C, n= 3 to 168) cells at indicated time points. B and D, firing rate of two light-insensitive cells recorded similutaneously from the SCN (B) and periventricular hypothalamaus (D)
