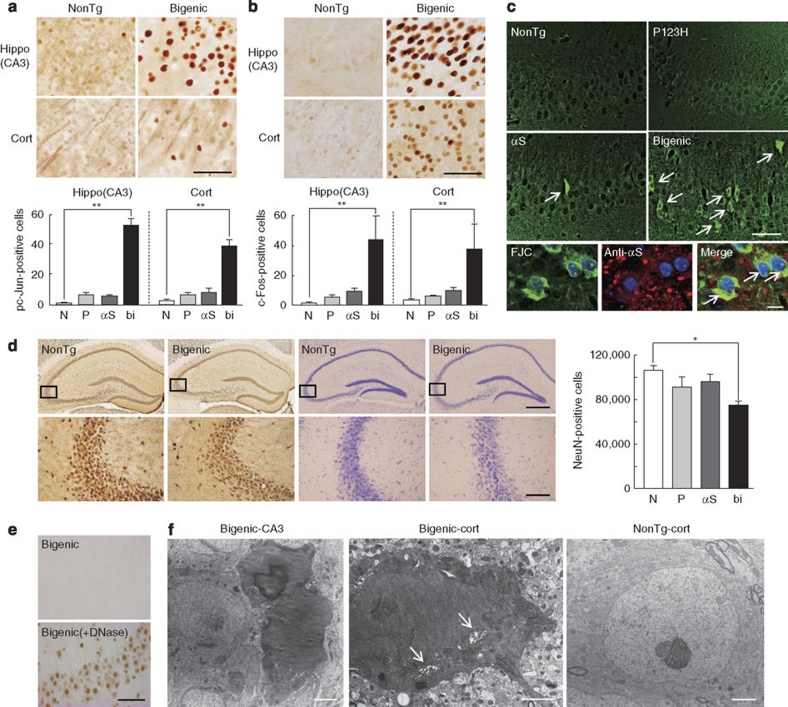
Figure 4. Non-apoptotic neurodegeneration in bigenic mice overexpressing P123H βS and αS.
Hippocampus (hippo) CA3 and cortex (cort) of 9-month-old bigenic mice and littermates (P123H βS tg, αS tg and non-tg) were analysed. Abbreviations used in graph panels are non-tg, N; P123H βS tg, P; αS tg, αS; and bigenic, bi. (a, b) Immunohistochemistry of pc-Jun (a) and c-Fos (b). Representative images of bigenic mice and NonTg littermates are shown. Scale bar=50 μm. The graph shows quantification of the pc-Jun-positive cell count in 180×180 μm2 areas. Data are shown as mean±s.e.m. (n=5 for a, n=8 for b). **P<0.01 versus non-tg mice. (c) Evaluation of neurodegeneration by FJC staining. Representative images of the hippocampus from bigenic mice and from other littermates are shown (four figures in the upper panel). FJC-positive cells were observed in bigenic mice and to a lesser extent in αS tg mice (arrows). Scale bar=50 μm. Lower images show that FJC-stained cells were also positive for αS (arrows) in bigenic mice. Nuclei were simultaneously stained with DAPI (4,6-diamidino-2-phenylindole). Scale bar=10 μm. (d) Immunohistochemistry of NeuN. Representative images of NeuN (four panels to the left) and crystal violet staining (four panels to the right) of the hippocampus from bigenic mice and NonTg littermates are shown. Scale bar=500 μm (upper two panels) or 100 μm (lower two panels). The figures given in the lower panels are magnifications of the figures given in the upper panel. The graph shows neuronal density based on the NeuN-immunoreactive cell count (cells mm−3) in the hippocampus. Data are shown as mean±s.e.m. (n=5). *P<0.05 versus non-tg mice. (e) TUNEL staining. The hippocampus sections from bigenic mice were treated without (upper panel) or with DNase I (lower panel) (n=5). Representative figures are shown. Scale bar=50 μm. (f) Appearance of dark degenerating neurons in the hippocampus and cortex of bigenic mice, but not in NonTg brains, in EM. Neuronal soma and dendritic processes both showed darkened features. Arrows indicate dilated Golgi apparatus in the shrunken cytoplasm (centre). In some cases, membrane structures of the nucleus and cytoplasm were obscure (left), which may reflect the terminal stage of neurodegeneration. Scale bar=2 μm.

