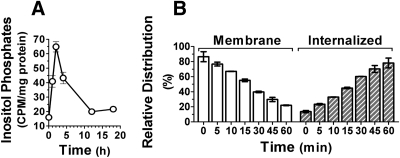
Fig. 1.
KISS1R signaling and trafficking in CHO-KISS1R cells. A, Time course of total inositol phosphate production in response to kisspeptin. CHO-KISS1R cells were stimulated with 10−9 m kisspeptin for 0–18 h and lysed. Total inositol phosphates were extracted and normalized to protein content. Data are the mean ± se of triplicate samples from a representative experiment, repeated at least three times with similar results. B, Rate of KISS1R trafficking. CHO-KISS1R cells were equilibrated on ice with 100,000 cpm of 125I-kisspeptin followed by incubation at 37 C for 0–60 min as indicated. Membrane-bound 125I-kisspeptin was extracted by acidic wash and internalized 125I-kisspeptin was collected after cell lysis. Distribution of 125I-kisspeptin in the membrane (open bars) and internalized (hatched bars) fractions is represented as relative percentage of 125I-kisspeptin at specific time points as indicated. Results are the mean ± sem of three independent experiments.

