Figure 3.
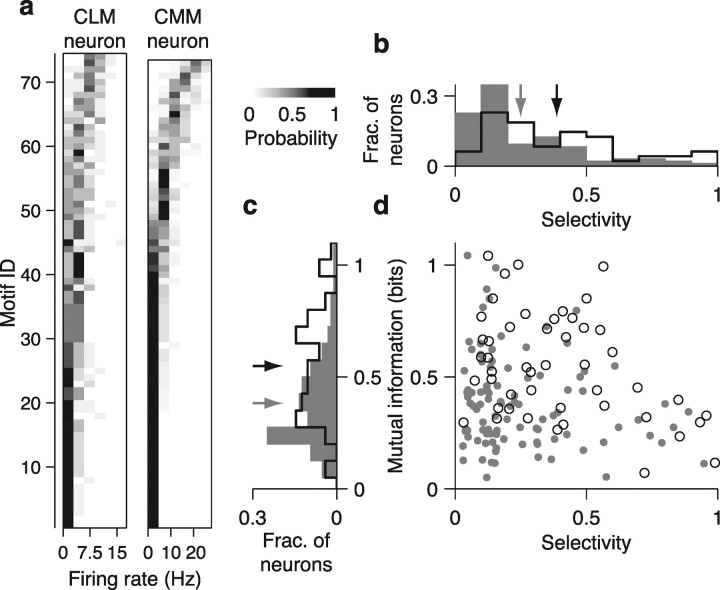
Motif selectivity and information encoding in CLM and CMM neurons. a, Distributions of firing rates conditional on motif identity for the CLM neuron (left) and CMM neuron (right) shown in Figure 2, a and b, respectively. Each row in each panel shows the firing rate distribution for a single motif. Motifs are arranged in order of ascending mean firing rates and the conditional probability is encoded in grayscale. b, Distribution of motif selectivity values for CLM (gray bars) and CMM (black line) neurons. Gray arrow denotes mean for CLM neurons, black arrow denotes mean for CMM neurons. c, Distribution of motif information values for CLM (gray bars) and CMM (black line) neurons. Arrows are as in b. d, Relation between mutual information and motif selectivity in CLM (dots) and CMM (circles) neurons. CMM neurons tend to have either low motif selectivity or low mutual information, but not both. CLM neurons can have both low motif selectivity and low mutual information.

