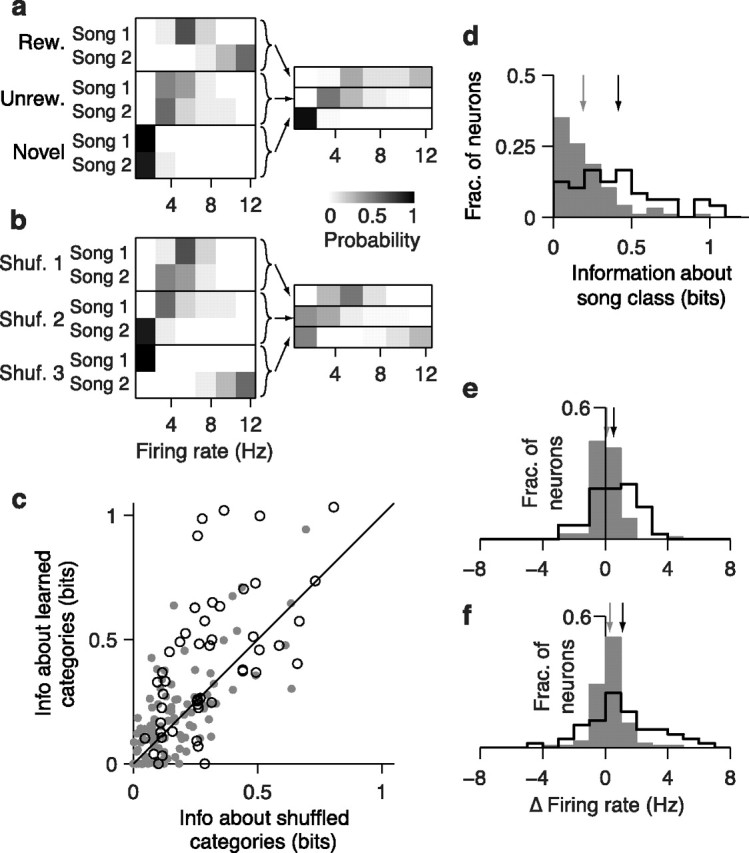
Figure 8.

Effects of learning on encoding of song category in CLM and CMM. a, Probability distributions of firing rates in response to songs for the sample CMM neuron depicted in Figure 2b, conditional on song identity (left) and behavioral category (right). Rew. denotes rewarded songs and unrew. denotes unrewarded songs. Arrows depict the construction of category-conditional distributions. b, Probability distributions as in a but for the randomly shuffled (Shuf.) category with the highest information. c, Comparison of information encoded about the learned categories (rewarded, unrewarded, novel), and the mean information about randomly shuffled categories for all CLM (gray dots) and CMM (open circles) neurons. Black line is the unity line. d, Distributions of category information values for CLM neurons (gray bars) and CMM neurons (black outline). Arrows denote means for CLM (gray) and CMM (black). e, Distribution of the change in average firing rate between novel songs and rewarded songs for CLM neurons (gray bars) and CMM neurons (black outline). Positive values indicate higher firing rates for rewarded songs. Arrows denote means for CLM (gray) and CMM (black). f, Distribution of the change in average firing rate between unrewarded songs and rewarded songs for CLM neurons (gray bars) and CMM neurons (black outline). Positive values indicate higher firing rates for rewarded songs. Arrows are as in e.
