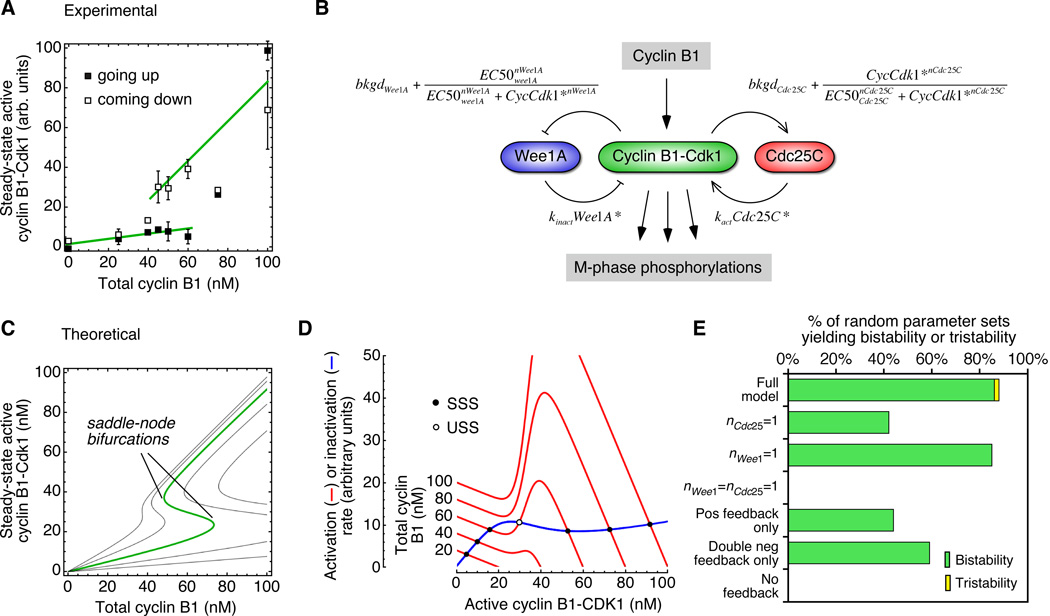
Figure 7. A Model Based on the Experimentally-Observed Response Functions for Wee1 and Cdc25C Accounts for the Bistability of the Mitotic Trigger.
(A) Experimental data for the hysteretic response of Cdk1 to recombinant Δ65-cyclin B1 in Xenopus egg extracts. Data are taken from a previous publication (Pomerening et al., 2003).
(B) Schematic view of the regulation of cyclin B1-Cdk1 activity by cyclin B1, Wee1A, and Cdc25C. (C) Theoretical steady-state responses based on Equation 6, for five assumed values of kWee1A/kCdc25C (left to right: 0.125, 0.25, 0.5 (green), 1, 2). (D) Rate-balance plots. The calculated rates of Cdk1 activation (red curves) and inactivation (blue curve) as a function of the concentration of active cyclin B1-Cdk1. The five red curves correspond to five assumed total cyclin concentrations. The ratio kWee1A/kCdc25C is assumed to be 0.5.
-
bkgdCdc25C = 0 to 0.4 (experimental estimate = 0.2)bkgdWee1A = 0 to 0.4 (experimental estimate = 0.2)EC50Cdc25C = 20 to 80 nM (experimental estimate = 30 nM)EC50Wee1A = 20 to 80 nM (experimental estimate = 35 nM)nCdc25C = 5 to 15 (experimental estimate = 11)nWee1A = 1.5 to 8 (experimental estimate = 3.5)kWee1A/kCdc25C = 0 to 1.5

