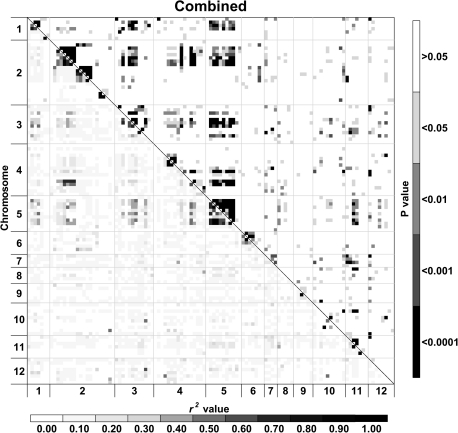
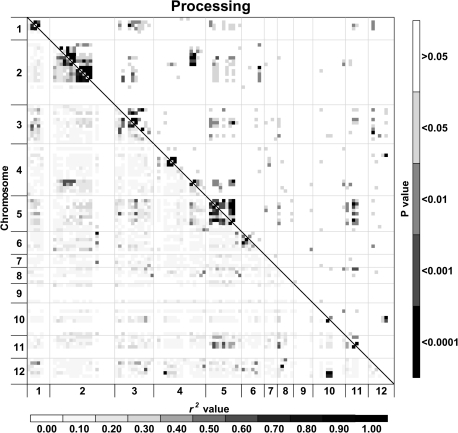
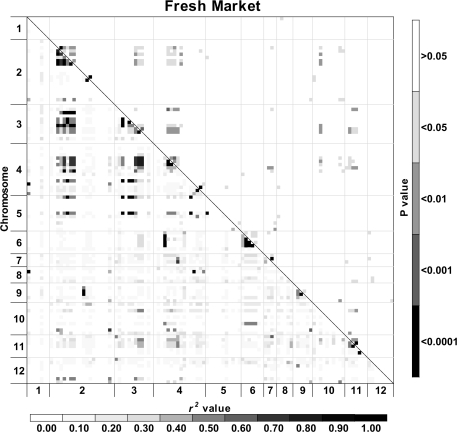
Fig. 4.
Heat maps of linkage disequilibrium (LD) values (r2) throughout the tomato genome. Markers were ordered on the x and y axes based on genomic location so that each cell of the heat map represents a single marker pair. The r2 values for each marker pair are on the bottom half of the heat map and are represented by shades of grey from 0.0 (white) increasing in darkness in equal increments of 0.1 to 1.0 (black). The P-values of each r2 estimate are on the top half of the heat map and are represented by shades of grey from non-significant (P >0.05; white) to highly significant (P <0.0001; black). The combined analysis includes processing, fresh market, and vintage cultivars.


