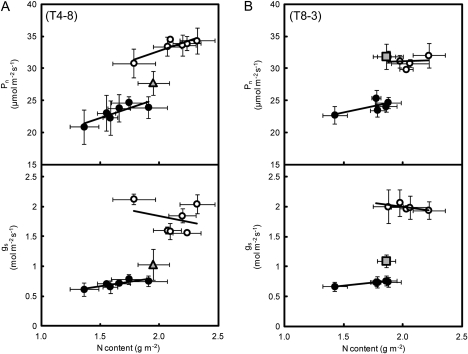
Fig. 5.
Relationships between nitrogen content (N) and the rate of photosynthesis (Pn; upper panels) and stomatal conductance (gs; lower panels) of flag leaves of homozygous recombinant lines and parental cultivars after growth in the paddy field to the full heading stage. Filled circles, open circles, shaded triangles (in A) and shaded squares (in B) represent Koshihikari, Habataki, T4-8, and T8-3, respectively. The measurements in (A) were made with an LI-6200 system and those in (B) were made with an LI-6400 system at an ambient CO2 concentration of 370 μl l−1 between 08:30 and 11:00. Vertical and horizontal bars represent the SD (n=5).

