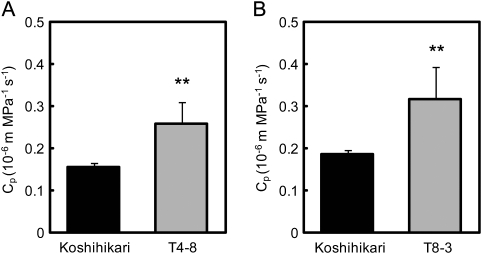
Fig. 6.
Hydraulic conductance from roots to the flag leaf (Cp) in T4-8 (A) and T8-3 (B) compared with that in Koshihikari after growth in the paddy field to the ripening stage. Cp was expressed on a per leaf area basis. Vertical bars represent the SD (n=5). Asterisks ** indicate significance at the 0.01 level, as compared with Koshihikari (t-test).

