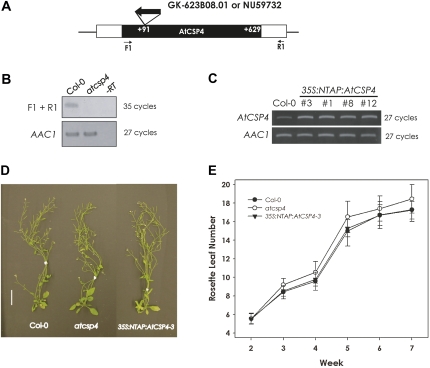
Fig. 2.
Morphological phenotype of a T-DNA insertion allele and overexpression of AtCSP4 in vegetative tissues. (A) Genetic map of the T-DNA insertion position within the AtCSP4 locus. A white box represents the AtCSP4 exon and black boxes represent its 5′- and 3'-untranslated regions. With respect to the open reading frame, this GABI-Kat line has an insertion at +91 bp. (B) Semi-quantitative RT-PCR analysis of AtCSP4 expression in leaves from plants at 28 DAG of the wild type (Col-0) and AtCSP4 in the GABI-Kat T-DNA insertion line. PCR was performed for the described cycle numbers with primers flanking the insertion and additional non-flanking primers. AAC1 was used as an internal control. All semi-quantitative RT-PCR figures are representative images from three replicate reactions. (C) Semi-quantitative RT-PCR analysis of AtCSP4 expression in leaves from 28 DAG of the wild type (Col-0) and three different independent 35S:NTAP:AtCSP4 transgenic lines exhibiting the defective seed phenotype. (D) Comparison of whole plants at 42 DAG. All plants were grown in soil under long-day conditions (bar=2 cm). (E) Total leaf number in wild-type, atcsp4, and 35S:NTAP:AtCSP4-3 plants. Leaf number was counted weekly post-germination (n=30). All plots show the means, and error bars represent the standard deviation.

