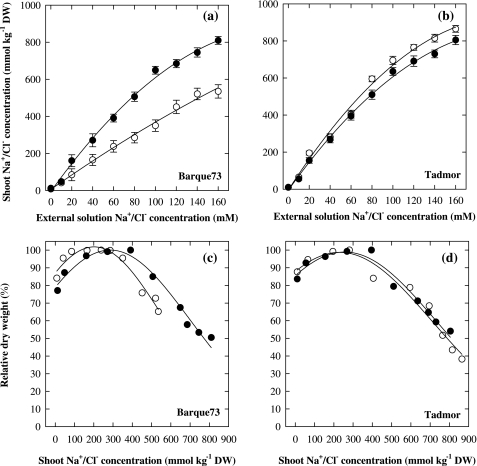
Fig. 1.
The whole shoot concentration of Na+ (black circles) and Cl– (open circles) of Barque73 and Tadmor as a function of the external concentration of Na+ and Cl– in hydroponic solution (a, b) and the relationship between relative shoot dry matter (%) and shoot Na+ and Cl– concentration. The dry matter weight of Barque73 and Tadmor in the control treatment was 4.45 g and 4.59 g, respectively. Bars indicate the standard error of the means. Fitted curves for (a) and (b) are derived from linear or exponential regressions, while the curves in (c) and (d) are the best fit of gaussian equation (three parameters). Values are means (n=3).

