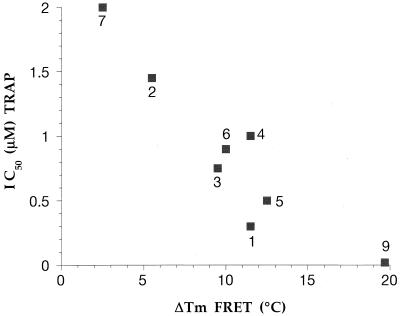
Figure 3.
Correlation between telomerase inhibition (y axis; expressed as the concentration necessary to obtain 50% inhibition of telomerase activity in a standard TRAP assay) and G4 stabilization (x axis; expressed as ΔTm of the F21T oligonucleotide). The ΔTm was measured at 0.2 μM F21T strand concentration, with 1 μM ligand, in a 0.1 M LiCl, 10 mM sodium cacodylate, pH 7.3 buffer. Average of at least two independent experiments. The compound number is indicated for each point. Compound 8 was excluded from this graph as it exhibited no antitelomerase activity at the highest concentration tested (10 μM).

