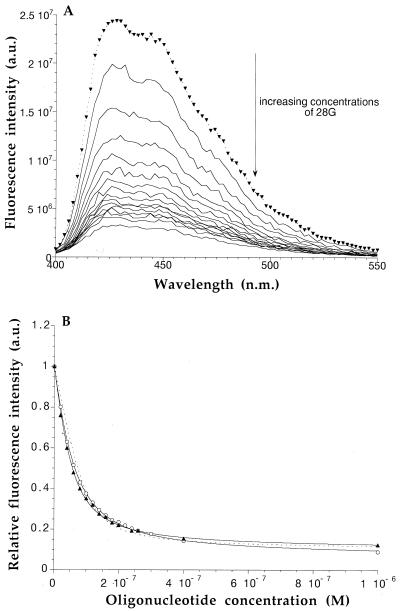
Figure 4.
(A) Fluorescence emission spectra of 1 (0.1 μM) in the absence (▾) or in the presence of increasing concentrations of a G4-DNA oligonucleotide (28G: 20, 40, 60, 80, 100, 120, 140, 160, 180, 200, 220, 240, 260, 300, and 400 nM). The titration was performed at room temperature, using 1 cm path-length quartz cells, in a 10 mM sodium cacodylate, 0.1 M KCl, pH 7.3 buffer. (B) Titration curve of the total fluorescence emission of 1 as a function of G4-oligonucleotide concentration (●: 28G; ▴: 22A). The best fits for both titrations assuming two independent binding sites are shown as solid lines. The best fit for the titration by 28G assuming a single binding site is shown as a dotted line.

