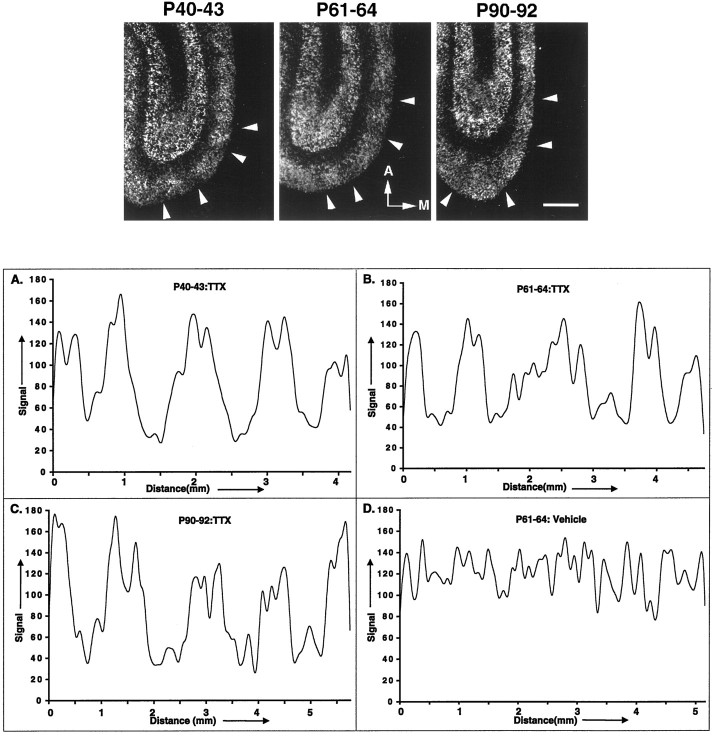
Fig. 7.
Activity regulation of feline cpg15in primary visual cortex. Top, After monocular activity blockade for the indicated times, horizontal sections through the visual cortex, optimal for viewing ODCs, were prepared and analyzed byin situ hybridization. Results are presented in dark-field optics. Note the periodicity of signal intensity, with several regions of decreased signal indicated byarrowheads on each panel.A, Anterior. M, medial. Scale bar, 1 mm.Bottom, Signal intensity was quantified in the superficial layers (described in Materials and Methods) and found to have a spatial frequency of ∼1 mm, as would be expected if the periodicity observed corresponds to inputs from the control (higher signal) and activity-blocked (lower signal) eyes and therefore ocular dominance columns. Note that no such regular periodicity in signal was observed when the analysis was performed on visual cortex from an animal monocularly treated with vehicle from P61 to P64 (D).

