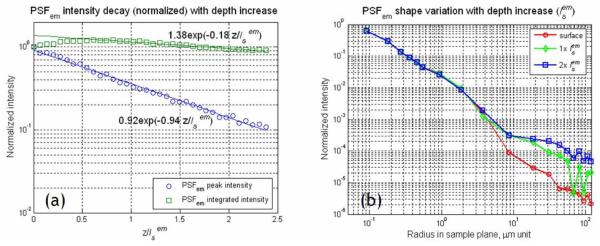
Fig. 3.
Effects of emission photon scattering on PSFem peak intensity and shape. (a) Decay profiles of PSFem peak intensity and integrated intensity (over a 200 μm diameter circular area) as a function of normalized imaging depth down to . The lines denote best exponent fit of the data points. (b) Variations in the PSFem lateral profile (PSFem(r, φ) in cylindrical coordinates) with the imaging depth. The PSFem profile was measured up to 100 μm in radius from peak location. Data points are connected by lines for eye guidance.

