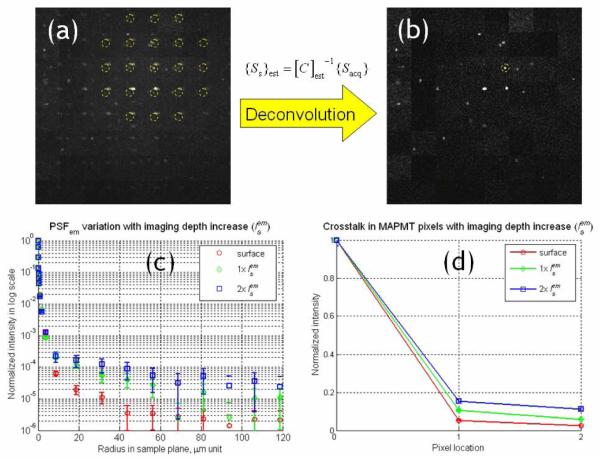
Fig. 7.
The effect of emission photon scattering on images acquired with MAPMT-based MMM. (a) An image of microspheres at deep from the surface in the tissue phantom sample. Ghost images appeared due to the scattered emission photons collected in neighboring pixels of the MAPMT. (b) Image after the deconvolution process. (c) Variation of PSFem due to emission photon scattering. The increase of intensity in the tail region was due to emission photon scattering. (d) Crosstalk in the MAPMT pixels. It was calculated by integrating the PSFem over the effective detection area of individual MAPMT pixels.

