
Figure 2.
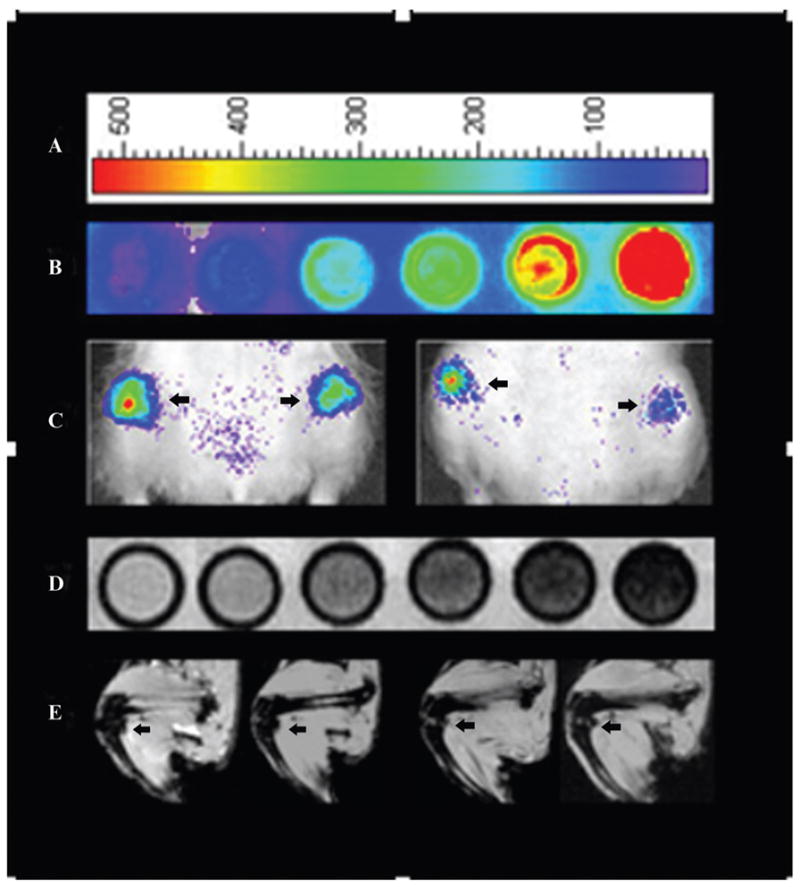
A, Optical image (OI) representative color scale. B, OI of in vitro bilabeled human mesenchymal stem cells (hMSCs) in increasing cell concentration from left to right: control, 62,500, 125,000, 250,000, 500,000, and 1,000,000. C, OI of intra-articular bilabeled hMSCs in decreasing cell concentration from left to right, as defined by an arrow pointing to each joint: 250,000, 125,000, 62,500, and 31,250. D, T2* magnetic resonance imaging (MRI) of in vitro bilabeled hMSCs in increasing cell concentration from left to right: control, 62,500, 125,000, 250,000, 500,000, and 1,000,000. E, T2* MRI of in vivo bilabeled hMSCs in decreasing cell concentration from left to right, as defined by an arrow pointing to each joint: 250,000, 125,000, 62,500, and 31,250.