
Figure 3.
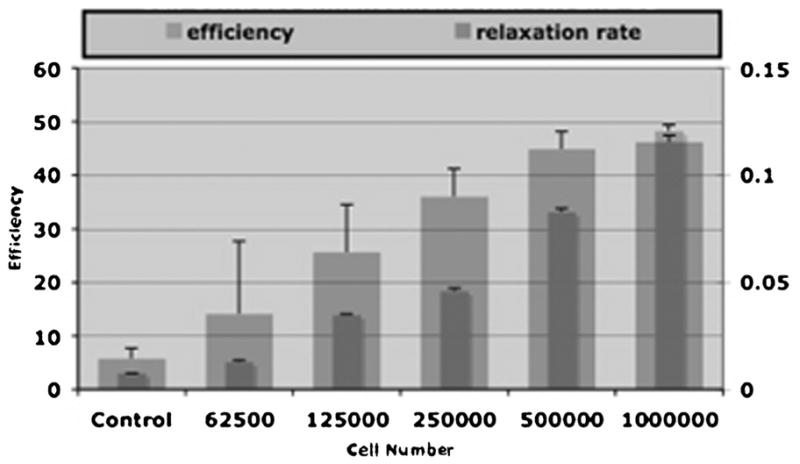
Mean signal intensities and standard deviations of increasing cell numbers of bilabeled human mesenchymal cells measured by region of interest with optical imaging (OI) (efficiency) and magnetic resonance imaging (T2* relaxation rate). There was a significant increase in OI signal with increasing cell concentration (p < .05). There was a significant decrease in the T2* relaxation rate with increasing cell concentration (p < .05).