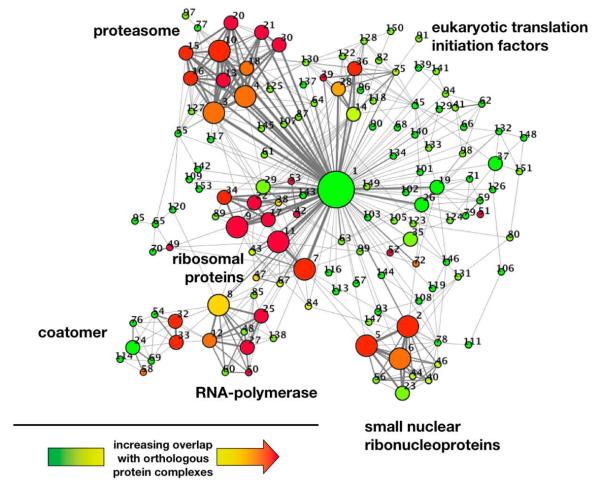
Figure 4.
Representing the overlapping nature of clusters, we represent links between clusters if they share proteins. In particular, the size of nodes and width of edges reflects the size of the clusters and the number of shared proteins, respectively. The color of nodes indicates the degree of overlap with conserved protein complexes in yeast, where a gradient from green to red indicates increasing overlap. As for functional complexes, we find large groups of overlapping complexes providing protein degrading and producing, polymerase, ribosome and coatomer functions as well as small nucleoproteins. Numbers indicate clusters in the Supplementary Table 2, where each cluster is annotated with its proteins.

