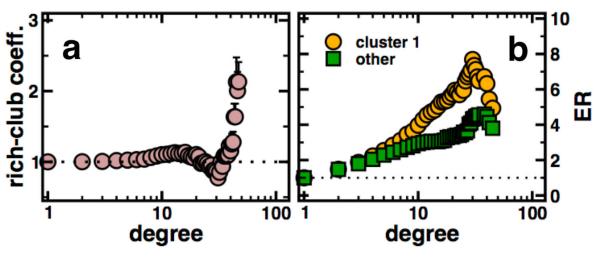
Figure 5.
(a) The distributions of the mean rich-club coefficient ρ(k) shows an increase with elevated connectivity in the parasites protein interaction network, suggesting the presence of an oligarchy of highly interacting and intertwined proteins. (b) Determining the enrichment of proteins that appear in the central cluster 1 and other clusters in Fig. 4, we largely find that especially proteins in rich clubs tend to appear in cluster 1.

