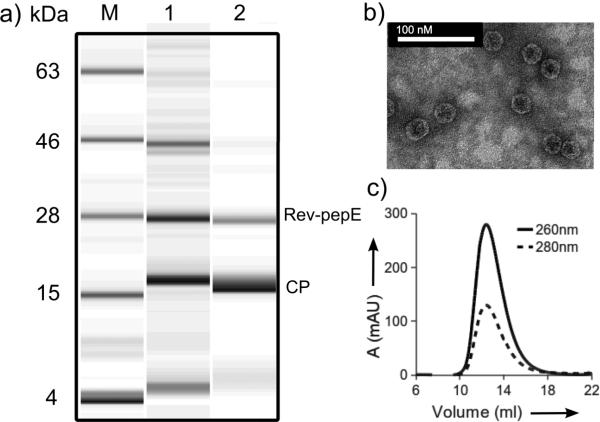
Figure 2.
Characterization of Qβ@(RevPepE)18. (A) Electrophoretic analysis: lane M = protein ladder marker, 1 = E.coli cell lysate 4 h after induction, 2 = purified particles showing CP and Rev-pepE bands. (B) Transmission electron micrograph; images are indistinguishable from those of WT Qβ VLPs. (C) Size-exclusion FPLC (Superose 6) showing the intact nature of the particles.

