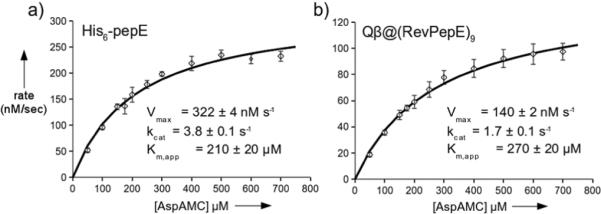
Figure 3.

Kinetics of PepE-catalyzed hydrolysis of fluorogenic Asp-AMC. Squares show the average of three independent initial rate measurements (<4 min) with standard deviation as the error bars. Solid curves show the best fit using the Michaelis-Menten equation, giving the parameters shown.
