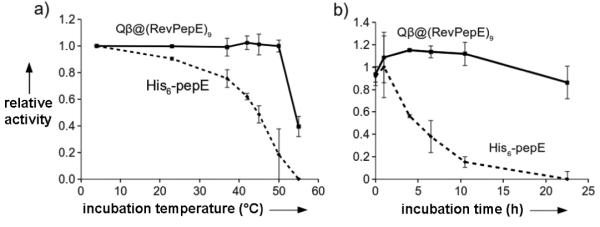
Figure 4.
Protection from thermal and protease inactivation of peptidase E by encapsidation. (A) Relative initial (<10 min) rates of substrate hydrolysis after incubation of the enzyme for 30 min at the indicated temperature followed by cooling to room temperature before assay. The rate exhibited by enzyme incubated at 4 °C was set at 100%. (B) Relative initial rates of substrate hydrolysis after incubation at specified time with proteinase K. Data is represented as a percentage of a buffer control at each time point. Points are averages of independent measurements in triplicate and error bars are the standard deviation.

