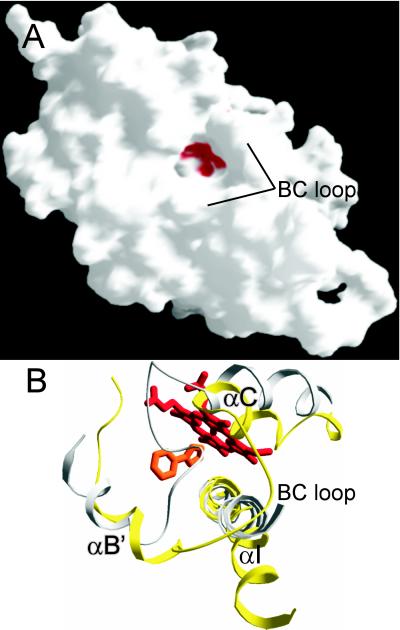
Figure 3.
(A) Surface representation of MTCYP51 structure. Heme, shown in red, is accessible from the surface through the open mouth of the substrate entry-channel 1. Surface was generated with GRASP (35). (B) View of substrate-binding site from the direction of the substrate entry along channel 1. Gray ribbon represents the P450BM3 (31), and yellow represents MTCYP51. Both structures were superimposed so that rms deviation for the most structurally homologous regions is 1.15 Å. For MTCYP51, regions of highest structural homology based on SWISS-PDB VIEWER superimposition algorithm include G41-R64, M110-C151, A256-L289, Q306-Y370, and W382-R448, which correspond to regions F40-D63, M112-C156, A264-L297, Y313-F379, and H388-K451 in P450BM3. MTCYP51 BC loop is open and lies above the N terminus of the bent I helix, which is pulled away from the structural core.

