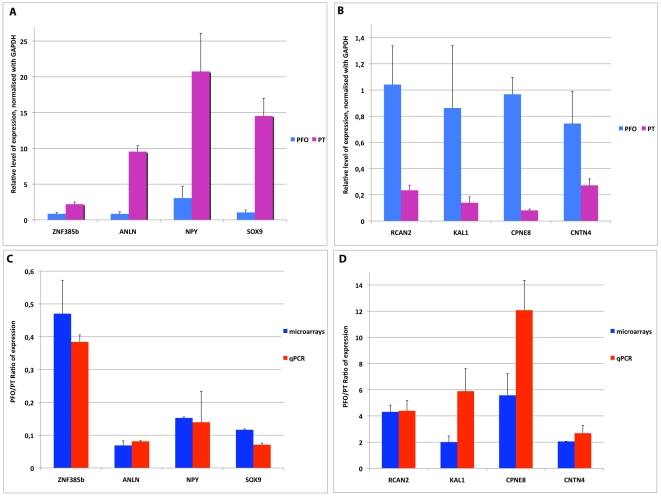
Figure 4. qRTPCR validation.
(A, B) qRTPCR relative expression levels of genes upregulated in PT (A) and PFO (B) using the ΔΔCT relative quantification method, normalized to the PFO-17GW-right sample. and to the housekeeping gene GAPDH. (C, D) Comparison of the PFO VS PT expression ratios in microarray and qPCR results. Mean of the PFO 17GW/PT17GW and PFO19GW/PT19GW ratios for the qPCR and microarrays results for genes upregulated in PT (C) and PFO (D).

