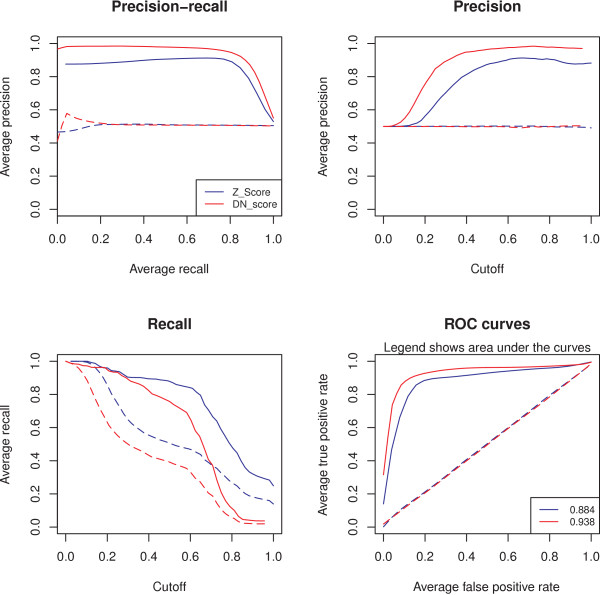
Figure 2.
Scores comparison. These graphs produced by QiSampler show the average performance of two scores (scaled to [0,1]), used to select PPIs from the same experimental dataset [10]. Performance was averaged over 1000 repetitions with a sampling rate of 25%. Dashed lines represent randomized data. Based on the Precision-recall and ROC graphs, the normalized DN score performs better than the z-score and a cut-off close to 0.3 would produce optimal values of recall and precision.

