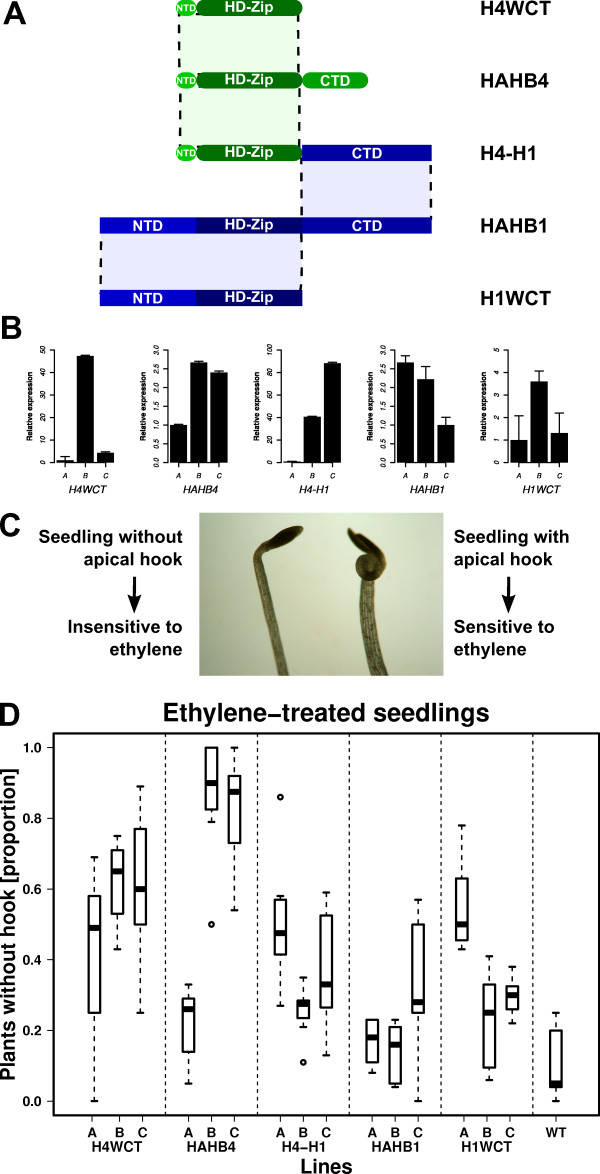
Figure 7.
Triple response to ethylene in chimerical transgenic plants. (A) Schematic representation of the different constructs used to transform Arabidopsis plants (B) Relative expression levels of the different transgenes in independent lines measured by qPCR. The line with the lowest expression was assigned an unitary level (1). (C) The sensitivity to ethylene was measured analyzing whether the seedlings developed apical hook (sensitive) or not (insensitive). The image exemplifies the phenotypes observed. (D) The results for three different lines from each genotype are presented in the boxplot.

